The price of coffee: the law of supply and demand in action

Coffee, the world's morning ritual.
In recent months, coffee made headlines once again due to sharp price increases in the United States.
According to data from the Bureau of Labor Statistics - the federal agency responsible for collecting and analysing information on the labour market, wages, inflation, and productivity - retail coffee prices in August 2025 saw the steepest annual rise since the start of the century. Ground coffee reached a record high of $8.87 per pound (around $19.50 per kilogram), and the Consumer Price Index for coffee rose by 21% compared to the previous year - the largest annual increase since 1997.
There are several reasons behind this surge. On one hand, adverse weather conditions in major coffee-producing countries such as Brazil and Vietnam led to poor harvests, reducing the global supply of coffee beans. On the other hand, political decisions have amplified the impact: in July 2025, U.S. President Donald Trump introduced a 50% tariff on imports of Brazilian coffee. Since Brazil is the leading producer of high-quality Arabica coffee and supplies roughly one-third of U.S. demand, the measure directly affected import volumes and coffee prices.
U.S. imports from Brazil halved compared to the previous year, and imports from other producers like Vietnam and Colombia failed to make up the shortfall. Stockpiles helped ease price pressures temporarily, but if Americans continue consuming coffee at the current rate, those reserves will eventually run out.
In other words, unless new supplies arrive, the shortage could become structural.
Why do prices rise when supply falls?
It’s the economic law of supply and demand. The price of a good is determined at the point where consumer demand meets producer supply.
Coffee supply and demand before the supply shock
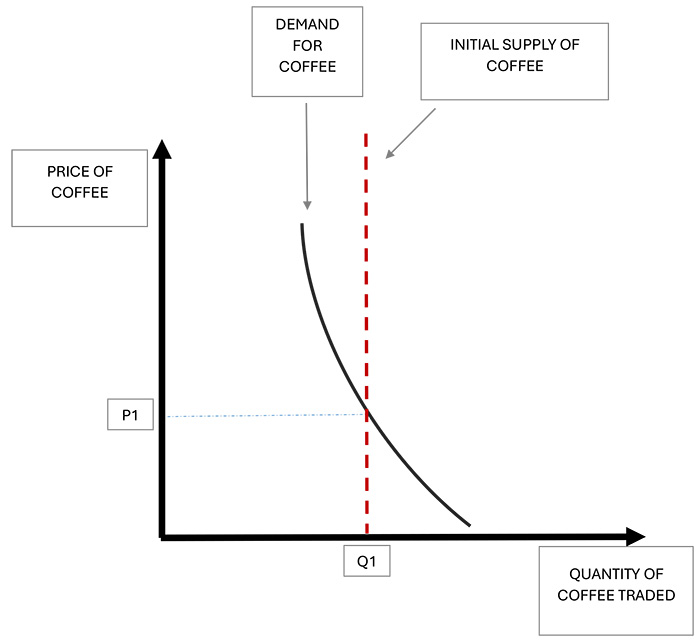
Let's imagine we're coffee importers sourcing beans from producing countries. If harvests are poor, many roasters will contact us to buy raw coffee, and we'll tend to raise our selling price. Conversely, if harvests are abundant, roasters won't be competing to secure beans, and we'll be willing to sell at a lower price.
People may be more or less sensitive to price changes. In some cases, they reduce their demand when prices rise; in others, they continue buying even if prices go up. If demand is relatively inelastic - as with coffee, which many people are reluctant to give up - then a reduction in supply leads to a sharper price increase, all else being equal.
This is exactly what happened in the U.S. coffee market: the demand curve is steep (i.e. demand is not very sensitive to price), and when supply fell (the corresponding "curve" - which is actually a vertical line, since in the short term the supply of coffee is fixed and determined by the harvested quantities - has shifted to the left), the equilibrium price where supply meets demand rose significantly.
Coffee supply and demand after the supply shock
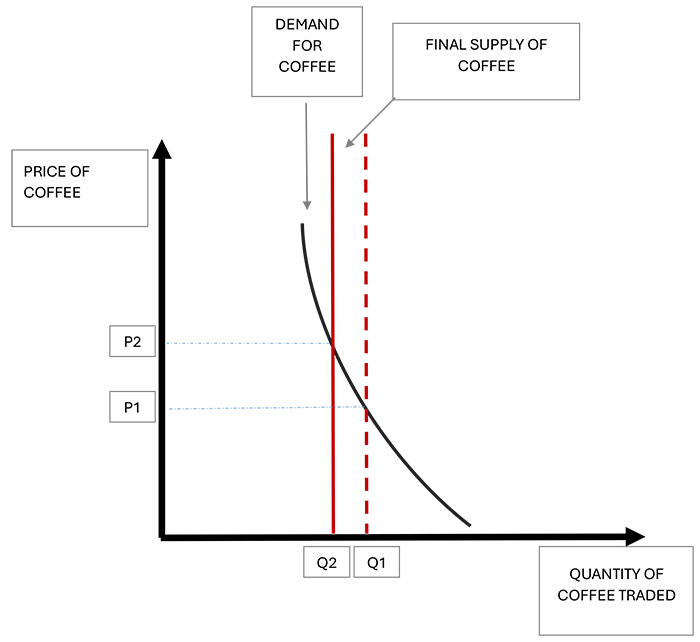
If, instead, many people stopped drinking coffee even with small price increases, the reduction in supply would lead to smaller price rises (the demand curve would be flatter).
In conclusion
The rise in coffee prices in the United States shows how the law of supply and demand works and how relevant it is to our everyday lives. This law doesn't just apply to agricultural commodities, oil, or metals, but to all goods and services in an economy.
Understanding the causes of price increases, and the shape and shifts of supply and demand curves, helps us better grasp how the economy functions and how become more informed citizens.

 RSS
RSS
 E-mail Alert